Modern observability without the legacy baggage.
Start FreeSimple Setup
Deploy in minutes
Global Access
Use from anywhere
Expert Support
Chat, email, and consulting available
Since Cisco acquired Splunk for $28B in March 2024, the observability landscape inside Cisco has two APM products, both kept active and sold under one Splunk Observability portfolio: Splunk APM (from the SignalFx acquisition, positioned for cloud-native workloads) and AppDynamics (acquired by Cisco in 2017, positioned for on-prem, 3-tier, and hybrid) (source: splunk.com/en_us/appdynamics-joins-splunk.html, verified 2026-06-21). Convergence is now actively shipping (a new OTel-based AppDynamics agent, deep linking, shared dashboards, and unified identity), so this is a multi-year merge in progress rather than an abandoned roadmap. The live question for teams is that you still choose a product lineage today for a net-new cloud-native workload that might go hybrid later, and you carry the integration risk while the merge completes. Pricing is enterprise-heavy at $60-75/host/month for the full-stack bundles ($55 is the standalone APM-only line), with additional costs for log analytics through the Splunk Platform.
IAPM is the product; spatial observability is the category. We are not an APM company, we are a spatial observability company.
One product. One roadmap. Zero acquisition risk.
Where Splunk Excels
Best-in-class log analytics and a SIEM heritage that IAPM does not challenge.
- Log analytics and SIEM leadership: the Splunk Platform's log analytics is best-in-class for security and compliance use cases. If your primary need is security operations or SIEM, Splunk is the right tool.
- Two decades of enterprise relationships and the depth of platform maturity that comes with them.
- Cisco portfolio integration: broad integration with Cisco's networking and security stack since the 2024 acquisition.
- NoSample full-fidelity tracing captures 100% of traces with no sampling artifacts (source: splunk.com APM features page, verified 2026-06-01), genuinely valuable for debugging rare issues.
Honest comparison is the trust signal.
The Two-Product Problem
Splunk APM and AppDynamics. Two products. One company. A multi-year merge in progress.
- Two active APM products inside Cisco with different positioning: Splunk APM (SignalFx) for cloud-native, AppDynamics for on-prem and hybrid. Both are kept active and sold under one Splunk Observability portfolio, and convergence is now actively shipping (a new OTel-based AppDynamics agent, deep linking, shared dashboards, unified identity), but customers adopting new workloads still choose between them today (source: splunk.com/en_us/appdynamics-joins-splunk.html, verified 2026-06-21).
- The real risk is the integration window: you pick a product lineage now for a net-new cloud-native workload that might later go hybrid, and you carry the merge risk while it completes.
- Enterprise-heavy pricing at $60-75/host/month for the full-stack bundles ($55 is standalone APM-only), plus separate Splunk Platform costs for log analytics.

One product. One roadmap. One price.

What If You Could Choose Clarity Instead?
Modern observability, purpose-built on OpenTelemetry.
- Single platform with a single roadmap. No acquisition integration uncertainty. No competing products from the same vendor.
- Your system rendered spatially in 3D, with AI that accesses your codebase workspace, diagnoses from 3D topology, and makes the fix.
- Built exclusively on OpenTelemetry, without the legacy baggage of multi-billion dollar acquisition consolidation.
Standard OTel. No proprietary forks. No lock-in.
Architecture: How We Differ
OpenTelemetry exclusive vs Splunk distribution.
IAPM is built exclusively on OpenTelemetry with no proprietary distribution. Standard OTel SDKs and Collectors work out of the box. No Splunk-specific forked collector, no enterprise sales motion, no multi-year commitment required.
Splunk has deep enterprise relationships built over two decades, a log analytics heritage that remains best-in-class for security and compliance use cases, and broad integration with Cisco's networking and security portfolio. Their NoSample full-fidelity tracing captures 100% of traces with no sampling artifacts (source: splunk.com APM features page, verified 2026-06-01), which is genuinely valuable for debugging rare issues.
| Aspect | IAPM | Splunk Observability |
|---|---|---|
| Instrumentation | Standard OpenTelemetry SDKs only | Splunk distribution of OTel Collector |
| Data Ingestion | Direct OTLP (gRPC + HTTP) | OTel Collector + SignalFx streaming engine |
| Visualization | 3D spatial topology | 2D dashboards, service maps, Tag Spotlight |
| Tracing | Distributed tracing with spatial context | NoSample full-fidelity tracing (100% capture) |
| Log Analytics | Integrated log management | Splunk Platform (petabyte-scale, SPL) |
| Vendor Lock-in | None. Change one endpoint URL to leave. | Splunk Platform ecosystem, enterprise contracts |
Tessa fixes code. You review it. You own it.
| Capability | Tessa (IAPM) | Splunk AI Assistant |
|---|---|---|
| Codebase Access | Full workspace: read, search, rename, modify | Splunk MCP Server (GA Feb 2026; source: help.splunk.com MCP Server docs, verified 2026-06-01) exposes observability data to external AI clients; no first-party workspace access |
| Spatial Context | 3D topology + traces + metrics | No spatial context |
| Code Fixes | Tessa proposes the fix in your workspace, you review, you approve | AI Troubleshooting Agent generates Remediation Plan guidance (kubectl commands, code blocks) that you copy and run manually |
| Focus Area | Application monitoring: topology, traces, metrics, code | Cross-signal RCA (metrics, events, logs, traces) + remediation plans (AI Troubleshooting Agent, GA Q1 2026); no source-code access |
| Pricing | Included in every tier, including the free Start tier | Included with bundles (capabilities limited) |
| Accountability Model | Human on the loop: Tessa does the work, you own the outcome | Query assistance and log summarization |
AI: Tessa vs Splunk AI Assistant
Human on the loop.
Tessa connects your production telemetry to your codebase. Add your repositories as workspaces, and Tessa can trace a production issue from your 3D topology straight to the source file. Tessa accesses your codebase workspace, diagnoses from 3D topology, makes the fix. You review, you own it. Human on the loop.
Splunk has moved well beyond log-only AI: the AI Troubleshooting Agent (GA Q1 2026) does cross-signal root-cause analysis across metrics, events, logs, and traces and produces remediation plans, and a Splunk MCP server exposes observability data to external AI clients (source: help.splunk.com, verified 2026-06-21). It is genuinely capable. The durable difference is what the AI can reach and own: Splunk's agent does not access your source code (its remediation is copy-and-run guidance) and has no spatial context, so when the investigation is done you still context-switch to your IDE to make the fix. Tessa accesses your codebase workspace, diagnoses from 3D topology, and proposes the fix in your workspace, human on the loop. Tessa closes that gap.
One price. No bundles. No separate log platform.
Pricing: The Full Picture
Scenario: 40 nodes, 10 engineers.
Splunk Observability Cloud prices by bundles with per-host and per-activity billing. Here is what a realistic production deployment looks like:
- No bundle confusion: IAPM includes APM, logs, and AI in one per-node price. Splunk offers three bundles with different feature sets at different price points.
- No separate log platform: Splunk's log analytics runs on the Splunk Platform with its own ingest-based pricing, often the largest cost component. IAPM includes log management.
- No activity-based surprises: Splunk offers MTS/usage-based billing alongside host-based billing (source: help.splunk.com billing docs, verified 2026-06-01), which can create unpredictable costs in high-cardinality environments. IAPM bills per node.
- Predictable math: Nodes x tier price = monthly cost. No enterprise sales engagement required to understand your bill.
| Line Item | IAPM | Splunk Observability |
|---|---|---|
| Infrastructure Monitoring | N/A | $15/host/mo x 40 = $600 (entry bundle; free up to 15 hosts) |
| APM (App & Infra bundle) | Included | $60/host/mo x 40 = $2,400 |
| Full Stack (End-to-End bundle) | N/A (application monitoring only) | $75/host/mo x 40 = $3,000 |
| Log Analytics (Splunk Platform) | Included | Separate Splunk Platform pricing (ingest-based) |
| On-Call | N/A | $5/user/mo x 10 = $50 (up to 10 seats) |
| AI Assistant | Included (Tessa) | Included (limited capabilities) |
| Estimated Monthly Total | $1,575 (Analyze) | $2,400-$3,050+ before log analytics |
Splunk pricing verified 2026-06-21 against splunk.com/products/pricing/observability. Actual costs vary by bundle selection and usage. IAPM pricing from immersivefusion.com/pricing. All prices USD.
You don't have to rip and replace
Run Both. Migrate Gradually.
Same telemetry, two destinations, zero re-instrumentation.
- Dual-destination: Splunk Observability already uses OpenTelemetry for data collection. Your OTel Collector can fan out telemetry to both Splunk and IAPM simultaneously.
- No code changes: Keep Splunk for your existing services. Point new services at IAPM. Compare the experience side by side with the same production data.
- Keep Splunk for logs and security: The Splunk Platform excels at log analytics and SIEM. Use IAPM for APM and spatial visualization alongside Splunk for security.
- No enterprise lock-in: IAPM has no multi-year commitments. Start free. Upgrade when ready. Leave if it is not right.
- Exit guarantee: If IAPM is not right for you, change one endpoint URL. Your instrumentation stays exactly the same.
Dual-Destination Collector Config
exporters:
  otlp/iapm:
    endpoint: "https://otlp.iapm.app"
    headers:
      API-Key: "YOUR-API-KEY"
  otlp/splunk:
    endpoint: "ingest.signalfx.com:4317"

service:
  pipelines:
    traces:
      exporters: [otlp/iapm, otlp/splunk]
    metrics:
      exporters: [otlp/iapm, otlp/splunk]
Standard OTel Collector config. Same telemetry, two destinations. No code changes required.
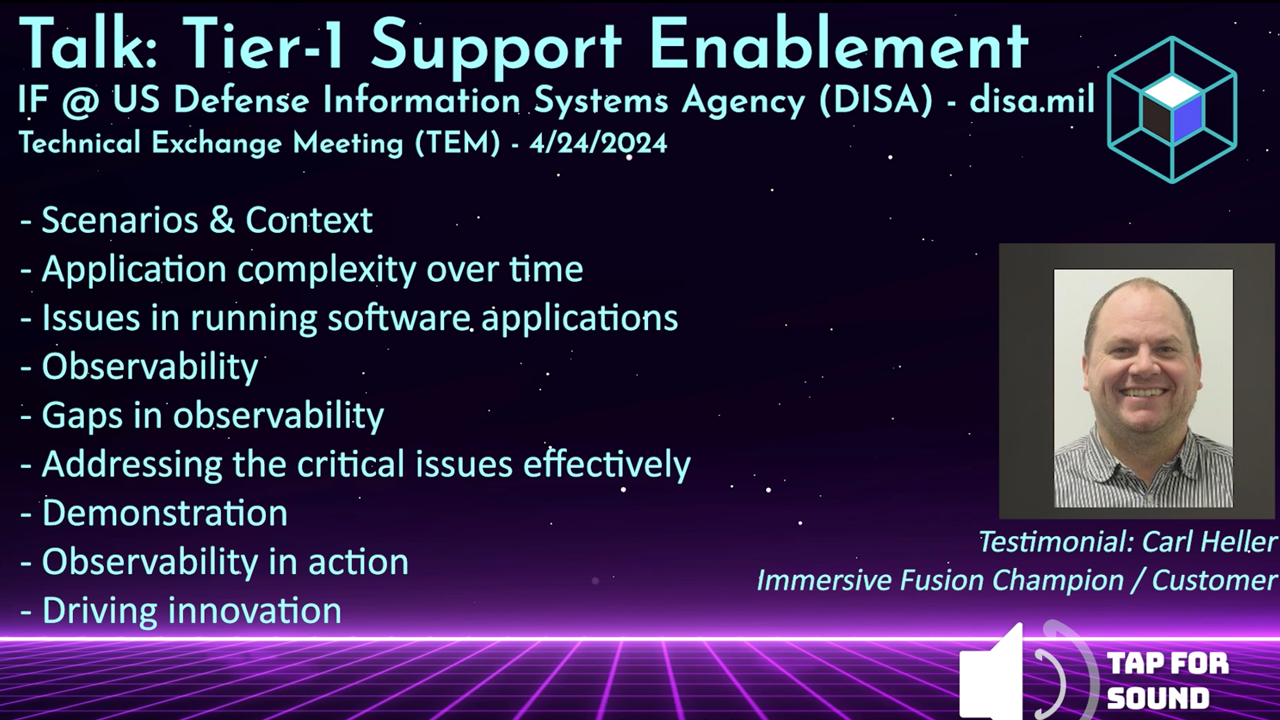
See what our customers are saying
Testimonial from the US Defense Information Systems Agency (DISA/disa.mil) talkWatch the testimonial from the DISA TEM talk | Request the full DISA TEM talk video
The Better Way to Monitor and Manage Your Software
Streamlined Setup
Simple integration
Cloud-native and open source friendly
Rapid Root Cause Analysis
Intuitive tooling
Find answers in a single glance. Know the health of your application
AI Powered
AI Assistant by your side
Unlock the power of AI for assistance and resolution
Intuitive Solutions
Conventional and Immersive
Expert tools for every user:
DevOps, SRE, Infra, Education