Open-source LLM tracing with application-level context.
Start FreeSimple Setup
Deploy in minutes
Global Access
Use from anywhere
Expert Support
Chat, email, and consulting available
Langfuse is a strong open-source LLM observability platform. Good prompt management, cost tracking, evaluation features, and a growing community. We respect the open-source commitment. Langfuse was acquired by ClickHouse (announced 2026-01-16) and stays MIT-licensed and self-hostable; ClickHouse's stated direction is an "Agentic Data Stack" (tighter LLM observability plus analytical database), not a move into full-stack or infrastructure observability (source: clickhouse.com/blog, verified 2026-06-21). So the scope split below holds. This page is an honest look at where IAPM takes a different approach, where Langfuse excels, and how you can evaluate both.
IAPM is the product; spatial observability is the category. We are not an APM company, we are a spatial observability company. The capabilities below (application-level correlation, service topology, cross-signal analysis) are how spatial observability un-compresses the high-dimensional reality of your system instead of flattening it to dashboards.
Open standards. Application-level context. AI-powered diagnosis.
Open-Source LLM Tracing Without the Full Picture
Great prompt tracking. No application-level correlation.
- MIT-licensed core (the /ee enterprise folders have separate terms) with a solid self-hosting story. Prompt management, cost tracking, and evaluation are well-designed for LLM-specific workflows. (source: github.com/langfuse/langfuse LICENSE, verified 2026-06-01)
- But LLM traces without application context tell an incomplete story. When your generative AI feature slows down, is it the model provider, the retrieval pipeline, or the application running your embedding service?
- Langfuse sees the LLM calls. It does not see the application underneath, the service topology around them, or the cross-signal correlations that reveal root cause.

Same open philosophy. Application-level scope.

Open Philosophy, Application-Level Scope
OpenTelemetry-native. Application monitoring included. AI diagnosis built in.
- Built exclusively on OpenTelemetry with no proprietary agents. IAPM shares Langfuse's commitment to open standards.
- 3D spatial topology: See your LLM services alongside the APIs, databases, and application they depend on.
- When something breaks, Tessa diagnoses across all layers and proposes the fix. Application-level correlation that Langfuse does not provide.
Managed spatial observability. Zero self-hosting burden.
Architecture: How We Differ
Managed spatial observability vs self-hosted LLM tracing.
Langfuse gives you open-source LLM tracing that you host and operate. IAPM gives you managed spatial observability with dependency correlation that reveals whether your LLM issue is actually an application dependency issue.
For teams that want full control over their LLM tracing data, Langfuse's self-hosted option is a real differentiator. For teams that want application-level correlation without the operational burden, IAPM delivers.
| Aspect | IAPM | Langfuse |
|---|---|---|
| Scope | Spatial observability: application + LLM telemetry un-compressed into one view | LLM observability (no service/infrastructure topology) (source: langfuse.com/docs/observability/overview, verified 2026-06-01) |
| Open Source | OpenTelemetry-native (open standard instrumentation) | MIT-licensed core; /ee enterprise folders have separate terms (source: github.com/langfuse/langfuse LICENSE, verified 2026-06-01) |
| Deployment | Managed SaaS (zero operational burden) | Self-hosted or Langfuse Cloud |
| Visualization | 3D spatial topology + web dashboards | Trace views, prompt dashboards |
| Service Topology | Auto-discovered 3D service map | No service/infrastructure topology (source: langfuse.com/docs/observability/overview, verified 2026-06-01) |
| Application Metrics | Application metrics via OTel correlated with traces | LLM application-level metrics (latency, tokens, cost); no service/infrastructure topology (source: langfuse.com/docs/observability/overview, verified 2026-06-01) |
| Prompt Management | Via codebase workspace (Tessa) | Prompt versioning, management UI (source: langfuse.com/docs/observability/overview, verified 2026-06-01) |
| Cost Tracking | Token and cost telemetry via OTel | Built-in LLM cost tracking (source: langfuse.com/docs/observability/overview, verified 2026-06-01) |
| Cross-Signal Correlation | Traces + metrics + logs unified in spatial view | LLM traces only |
Tessa fixes code. You review it. You own it.
| Capability | Tessa (IAPM) | Langfuse |
|---|---|---|
| AI Diagnosis | Cross-signal anomaly detection with spatial context | No Tessa-equivalent in-product agent; the authenticated data-platform MCP server now exposes read and write tools beyond prompt management, but it operates on LLM-trace data only (source: langfuse.com/docs/api-and-data-platform/features/mcp-server, verified 2026-06-21) |
| Codebase Access | Full workspace: read, search, rename, modify | No first-party workspace access; external Claude Code / Cursor / VS Code via MCP bring their own repo context |
| Code Fixes | Tessa proposes the fix in your workspace, you review, you approve | The Langfuse skill for Claude Code does annotate / analyze / revise loops on prompts. No first-party code-fix flow. (source: langfuse.com/blog 2026-02-16, verified 2026-06-01) |
| Root Cause Analysis | Application-level: LLM + app + dependencies | LLM trace-level only |
| Accountability Model | Human on the loop | Manual debugging by engineer |
AI: Tessa vs Manual Investigation
Human on the loop.
Tessa accesses your codebase workspace, diagnoses from 3D topology, and makes the fix. You review, you own it. When your LLM costs spike unexpectedly, Tessa does not just show you the token counts. She correlates the cost increase with traffic patterns, identifies which service is generating excessive LLM calls, traces it to the code path, and proposes the fix.
Langfuse gives you cost tracking dashboards to investigate manually. Tessa closes the gap between "I see the cost spike" and "the fix is ready for review."
One platform for LLM + application monitoring. One price. Zero ops.
Pricing: Managed Spatial Observability vs Self-Hosted LLM-Only
The true cost of self-hosting.
- One platform, not three: IAPM includes LLM observability, application monitoring, and AI diagnosis. Langfuse covers the LLM layer only.
- No operational burden: IAPM is a managed service. No infrastructure to provision, no upgrades to manage, no "monitoring the monitor."
- Predictable pricing: Nodes x tier price = monthly cost. No per-event or per-observation charges.
- AI included: Tessa is included in every tier, including the free Start tier. No separate AI add-on to budget for.
| Capability | IAPM | Langfuse |
|---|---|---|
| LLM Observability | Included | Self-hosted free / Cloud: Hobby free, Core $29/mo, Pro $199/mo, Enterprise $2,499/mo (source: langfuse.com/pricing, verified 2026-06-01) |
| Application Monitoring | Included | Not available (requires separate tool) |
| Application / Distributed Tracing | Included | Not available (requires separate tool) |
| AI Assistant | Included (Tessa) | Not available |
| Operational Burden | Zero (managed SaaS) | Self-hosted: upgrades, scaling, backups, monitoring the monitor |
| Spatial Observability Total | $45/node/month (Analyze) | Langfuse + APM tool + ops cost |
IAPM pricing from immersivefusion.com/pricing. Langfuse pricing from langfuse.com/pricing. Verify current pricing before purchase. All prices USD.
OpenTelemetry bridges both worlds
Already Using Langfuse? Add Application Context.
Keep Langfuse for prompts. Add IAPM for application-level depth.
- Keep Langfuse for prompts: If you rely on Langfuse's prompt management, keep it running. IAPM adds the spatial observability layer.
- Eliminate self-hosting burden: Move your observability to a managed service. Focus your team on building, not operating monitoring infrastructure.
- Dual-destination: Langfuse supports OTel trace ingestion (OTLP over HTTP; gRPC not yet supported). Your OTel Collector fans out telemetry to both IAPM and Langfuse simultaneously. (source: langfuse.com/integrations/native/opentelemetry, verified 2026-06-01)
- Exit guarantee: If IAPM is not right for you, change one endpoint URL. Your instrumentation stays exactly the same.
Dual-Destination Collector Config
exporters:
  otlp/iapm:
    endpoint: "https://otlp.iapm.app"
    headers:
      API-Key: "YOUR-API-KEY"
  otlphttp/langfuse:
    endpoint: "your-langfuse-instance/api/public/otel"

service:
  pipelines:
    traces:
      exporters: [otlp/iapm, otlphttp/langfuse]
    metrics:
      exporters: [otlp/iapm]
Standard OTel Collector config. LLM traces go to both. Application metrics go to IAPM.
Ready for LLM Tracing with Application Context?
Start free with IAPM. Your OTel instrumentation just works.
Start FreeCompare IAPM against other tools | LLM observability comparison | Take the product tour
See what our customers are saying
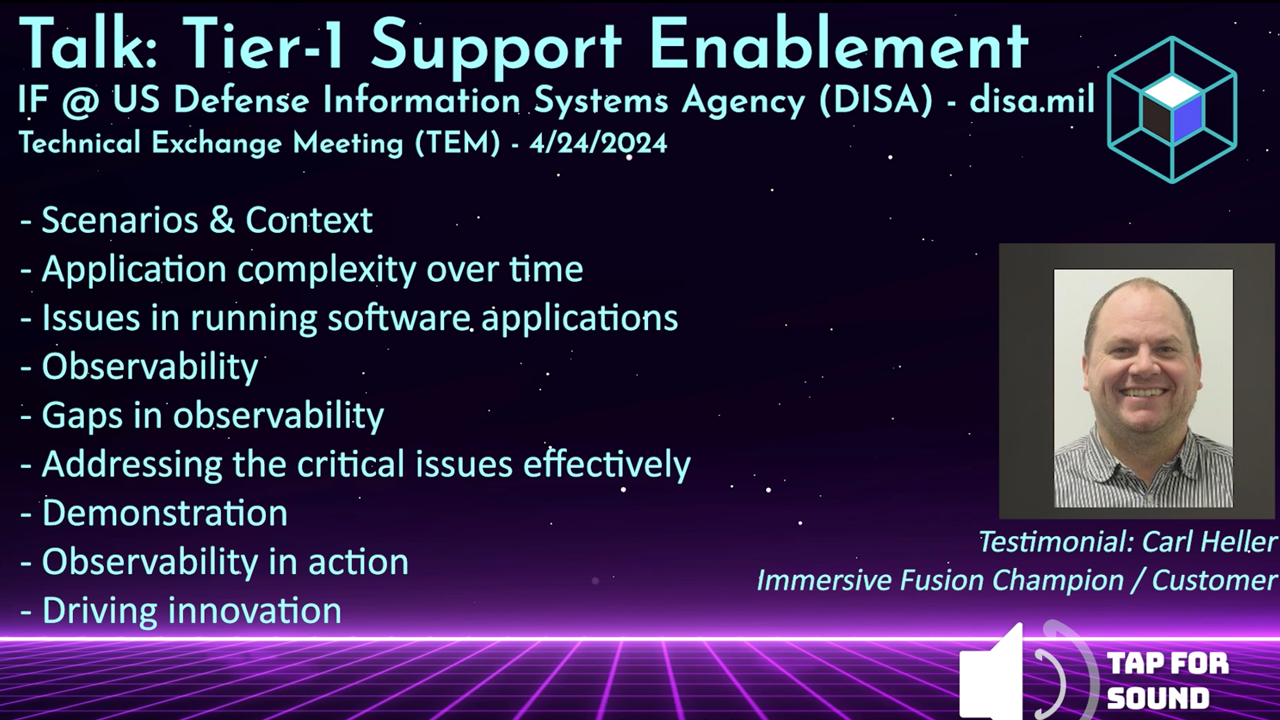
Testimonial from the US Defense Information Systems Agency (DISA/disa.mil) talkWatch the testimonial from the DISA TEM talk | Request the full DISA TEM talk video
The Better Way to Monitor and Manage Your Software
Streamlined Setup
Simple integration
Cloud-native and open source friendly
Rapid Root Cause Analysis
Intuitive tooling
Find answers in a single glance. Know the health of your application
AI Powered
AI Assistant by your side
Unlock the power of AI for assistance and resolution
Intuitive Solutions
Conventional and Immersive
Expert tools for every user:
DevOps, SRE, Infra, Education