LLM observability meets application-level visibility.
Start FreeSimple Setup
Deploy in minutes
Global Access
Use from anywhere
Expert Support
Chat, email, and consulting available
Arize Phoenix is an excellent LLM observability framework. 40+ auto-instrumentations (source: github.com/Arize-ai/openinference, verified 2026-06-01), best-in-class evaluation tools, and a free, self-hostable codebase (source-available; core under Elastic License 2.0). We respect that depth. This page is an honest look at where IAPM takes a different approach, where Phoenix excels, and how the two can work together.
IAPM is the product; spatial observability is the category. We are not an APM company, we are a spatial observability company.
LLM performance in the context of your entire application stack
Best-in-Class LLM Evaluation, Zero Application Context
When your LLM latency spikes, where is the bottleneck?
- 40+ auto-instrumentations (source: github.com/Arize-ai/openinference, verified 2026-06-01) covering OpenAI, Anthropic, LangChain, LlamaIndex, and more. Phoenix delivers deep LLM-specific visibility.
- But LLM calls do not execute in a vacuum. They depend on API gateways, vector databases, embedding services, and the application underneath.
- When your RAG pipeline slows down, is it the model, the retrieval layer, the database feeding context, or a noisy neighbor? Phoenix cannot answer that because it only sees the LLM layer.

One spatial view. Full application context. Faster resolution.

See Your LLM Calls in Full System Context
Topology as your primary investigation surface.
- 3D spatial topology: Your LLM services, the APIs that call them, the vector databases they query, and the relationships between all of them.
- When something breaks, you see it in context: which service is affected, what it depends on, where the problem propagates.
- No context switching between your LLM tracing tool and your application monitoring. One environment. Application-level visibility.
Zero proprietary agents. Full OTel ecosystem.
Architecture: How We Differ
Application-level correlation vs LLM-only tracing.
IAPM provides spatial observability across distributed tracing, metrics, logs, and LLM observability in a single spatial environment. When your LLM latency spikes, IAPM shows you whether the bottleneck is the model provider, your API gateway, the vector database, or an upstream dependency.
Phoenix shows you the LLM call. IAPM shows you the LLM call in the context of the entire request lifecycle and the application dependencies around it.
| Aspect | IAPM | Arize Phoenix |
|---|---|---|
| Scope | Spatial observability across application telemetry and LLM observability | LLM observability only (source: github.com/Arize-ai/phoenix, verified 2026-06-01) |
| Instrumentation | Standard OpenTelemetry SDKs (all signals) | OpenTelemetry-based (LLM spans via OpenInference) |
| LLM Auto-Instrumentation | OpenTelemetry GenAI semantic conventions | 40+ auto-instrumentations (OpenInference) (source: github.com/Arize-ai/openinference, verified 2026-06-01) |
| Visualization | 3D spatial topology | Trace tree views, evaluation dashboards |
| Service Topology | Auto-discovered 3D service map | No service topology (source: github.com/Arize-ai/phoenix, verified 2026-06-01) |
| Application Metrics | Application metrics via OTel correlated with traces | No application-level metrics (source: github.com/Arize-ai/phoenix, verified 2026-06-01) |
| LLM Evaluation | Evaluation via OTel-compatible pipelines | Best-in-class: hallucination, toxicity, relevance, custom evals |
| Cross-Signal Correlation | Traces + metrics + logs unified in spatial view | LLM traces only (source: github.com/Arize-ai/phoenix, verified 2026-06-01) |
Tessa fixes code. You review it. You own it.
| Capability | Tessa (IAPM) | Arize Phoenix |
|---|---|---|
| AI Diagnosis | Cross-signal anomaly detection with spatial context | No in-product AI diagnosis; Phoenix MCP server (@arizeai/phoenix-mcp) exposes traces / spans / prompts / datasets / experiments to external AI agents (Claude Code, Cursor) (source: github.com/Arize-ai/phoenix, verified 2026-06-01) |
| Codebase Access | Full workspace: read, search, rename, modify | External AI client must bring its own workspace access; Phoenix MCP exposes LLM observability data only |
| Code Fixes | Tessa proposes the fix in your workspace, you review, you approve | No first-party code-fix flow; Alyx (AX commercial tier) operates within the platform, suggesting prompt variants rather than editing your code (source: arize.com/blog/alyx-2-0, verified 2026-06-01) |
| Root Cause Analysis | Application-level: LLM + app + dependencies | LLM layer only |
| Accountability Model | Human on the loop | Manual debugging by engineer |
AI: Tessa vs Manual Investigation
Human on the loop.
Tessa accesses your codebase workspace, diagnoses from 3D topology, and makes the fix. You review, you own it. When your RAG pipeline degrades, Tessa does not just show you the LLM trace. It correlates the latency spike with the vector database query time, checks the application metrics, identifies the root cause, and proposes a code fix.
Phoenix gives you excellent LLM trace visibility to investigate manually. Tessa closes the gap between "I see the problem" and "the fix is ready for review."
One platform for LLM + application monitoring. One price.
Pricing: Application Observability Value
One platform vs LLM tool + APM tool + ops cost.
- One platform, not three: IAPM includes LLM observability, application monitoring, and AI diagnosis. Phoenix covers the LLM layer only.
- No tool sprawl: Avoid managing separate tools for LLM tracing and APM. One bill. One UI. Full correlation.
- Predictable pricing: Nodes x tier price = monthly cost. No per-trace or per-evaluation charges.
- AI included: Tessa is included in every tier, including the free Start tier. No separate AI add-on to budget for.
| Capability | IAPM | Arize Phoenix |
|---|---|---|
| LLM Observability | Included | Free and self-hostable (source-available; core under Elastic License 2.0) / AX Pro from $50/mo (source: arize.com/pricing, verified 2026-06-01) |
| Application Monitoring (APM) | Included | Not available (requires separate tool) |
| APM / Distributed Tracing | Included | Not available (requires separate tool) |
| AI Assistant | Included (Tessa) | Alyx (AX commercial tier) optimizes prompts in-platform; no codebase access, no code-fix |
| 3D Spatial Topology | Included | Not available |
| Application Observability Total | $45/node/month (Analyze) | Phoenix + APM tool = multiple bills |
IAPM pricing from immersivefusion.com/pricing. Arize Phoenix is open source; Arize platform pricing varies by plan. Verify current pricing at arize.com/pricing. All prices USD.
Keep Phoenix for evals. Add IAPM for application context.
Where Phoenix Excels
Honest comparison: if LLM quality loops are your primary job, Phoenix earns its place.
- Best-in-class evaluation framework: hallucination, toxicity, relevance, and custom evals are Phoenix's core strength. A team whose main job is iterating on LLM output quality gets real depth here.
- 40+ OpenInference auto-instrumentations (source: github.com/Arize-ai/openinference, verified 2026-06-01) make it fast to capture rich LLM spans across OpenAI, Anthropic, LangChain, LlamaIndex, and more.
- Alyx (Arize AX) for prompt optimization (source: arize.com/blog/alyx-2-0, verified 2026-06-01) automates prompt-variant experiments, so prompt-tuning workflows stay inside the platform.
If your primary need is tightening the LLM prompt quality loop, you may legitimately prefer Phoenix's depth there. That is not a contradiction with spatial observability: IAPM and Phoenix can be complementary. Keep Phoenix for evals, add IAPM for full application context.
Already Using Phoenix? Add Application Context.
OpenTelemetry makes it simple.
- Keep Phoenix for evals: If you love Phoenix's evaluation framework, keep using it. IAPM adds the application monitoring layer Phoenix does not cover.
- Zero re-instrumentation: Phoenix is built on OpenTelemetry via OpenInference. Your existing OTel instrumentation works with both.
- Run both side by side: Compare the experience. When you see the value of correlating LLM performance with application health, you will understand why application-level context matters.
- Exit guarantee: If IAPM is not right for you, change one endpoint URL. Your instrumentation stays exactly the same.
Dual-Destination Collector Config
exporters:
  otlp/iapm:
    endpoint: "https://otlp.iapm.app"
    headers:
      API-Key: "YOUR-API-KEY"
  otlp/phoenix:
    endpoint: "localhost:4317"

service:
  pipelines:
    traces:
      exporters: [otlp/iapm, otlp/phoenix]
    metrics:
      exporters: [otlp/iapm]
Standard OTel Collector config. LLM traces go to both. Application metrics go to IAPM.
Ready to See Your LLM Calls in Full Context?
Start free with IAPM. Your OTel instrumentation just works.
Start FreeCompare IAPM against other tools | LLM observability comparison | Enter a live system
Always-On Demo
Running right now, unscripted, and nobody started it for you. It is one of our live grids, not a customer's system, but nothing about it is staged: we point chaos at it and hunt the gap live. Watch for a minute, send it to whoever is on call with you, or scroll on and go play with one yourself.
That's our side of it. Now go try the alternative.
See what our customers are saying
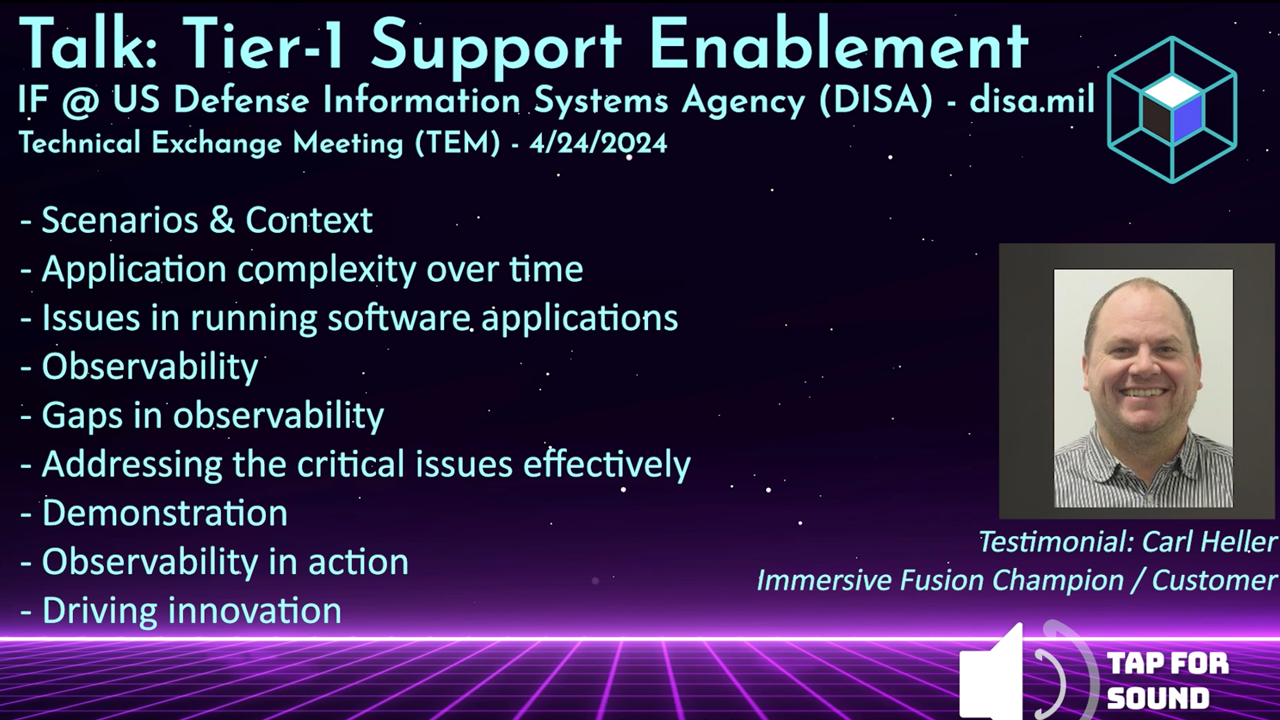
Testimonial from the US Defense Information Systems Agency (DISA/disa.mil) talkWatch the testimonial from the DISA TEM talk | Request the full DISA TEM talk video
The Better Way to Monitor and Manage Your Software
Streamlined Setup
Simple integration
Cloud-native and open source friendly
Rapid Root Cause Analysis
Intuitive tooling
Find answers in a single glance. Know the health of your application
AI Powered
AI Assistant by your side
Unlock the power of AI for assistance and resolution
Intuitive Solutions
Conventional and Immersive
Expert tools for every user:
DevOps, SRE, Infra, Education